

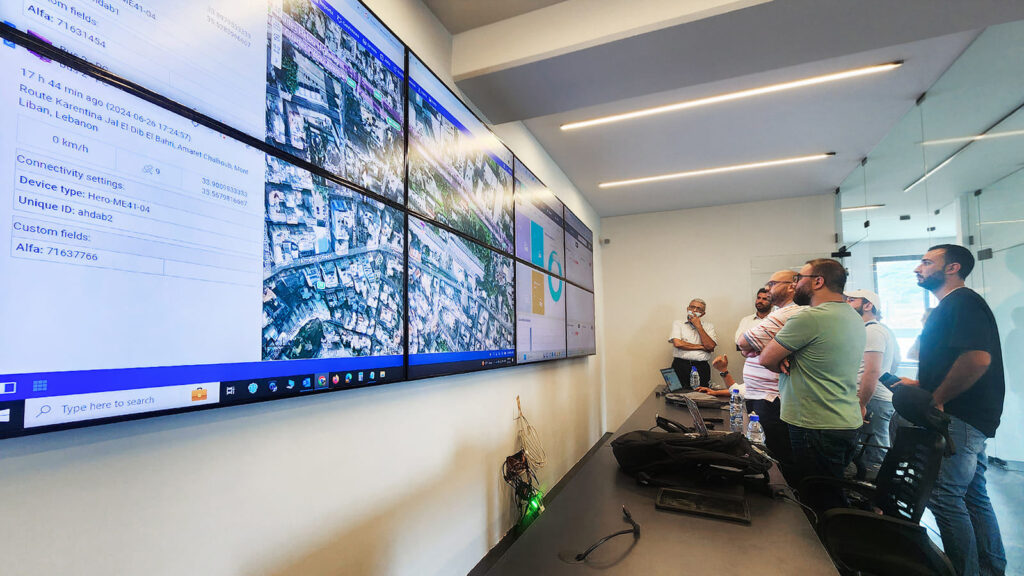
At La-Z-Boy Southeast I built a delivery dashboard that pulled our delivery operations into a single, current view — integrating data from the systems that ran the business so the team could see status, spot problems, and act without hunting through half a dozen tools.
The Challenge
Delivery information was spread across separate systems, each holding one piece of the picture. Answering a simple question — where does this stand? — meant checking several places and stitching the answer together by hand. Operations needed one screen, not six.
What I Delivered

Unified view
Brought delivery status and operational data into a single dashboard the whole team could read at a glance.

Systems integration
Connected the existing platforms so the dashboard drew live from the systems already in use.
Streamlined workflow
Replaced manual cross-checking with a current, at-a-glance view that cut the busywork out of the day.

Rollout & support
Delivered with training and ongoing support so adoption stuck and the tool kept earning its place.
Skills & Tools
The stack behind this build — tap any to see related work.
The Impact
One screen replaced the scavenger hunt. Operations got current visibility into delivery, decisions came faster, and the hours once spent reconciling systems went back to the work that actually mattered.
One Screen, Whole Picture
Most operational pain isn’t missing data — it’s data scattered across too many places. Pulling it into one honest dashboard is a pattern that pays off every time, and this was one of the first places I proved it.